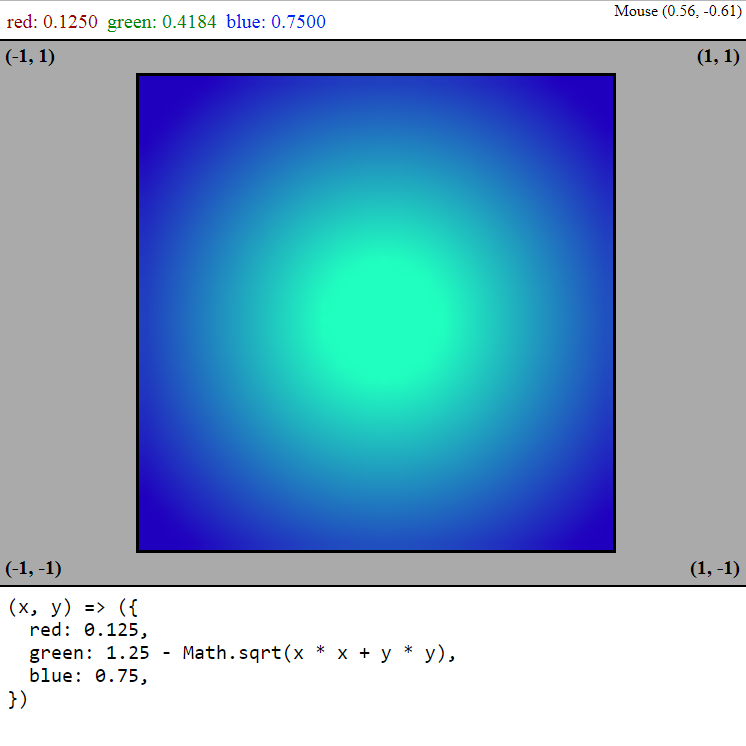
I recently developed a tool to help me work through some math that was proving difficult to visualize any other way. You can use this tool here: https://files.pineapplemachine.com/public/web/color-graph
Using this webpage, you can describe a JavaScript function accepting two inputs, X and Y, and see its output or outputs visualized as color intensities. The first time you load the page, a more detailed help text should appear. You can make the help text appear again at any time by clicking the “?” question mark help button in the bottom-right corner of the page.

